.png)
Market Knowledge
December 2025 Housing Market
Jan. 02, 2026 | CREB 2025 housing market shifted to more balanced conditions Calgary, Alberta, Jan. 2, 2026– Following several years ...
READ POSTBlogging has not been my strength and so this is officially a work in progress. I have some big plans for the blogging page in the foreseeable future so I ask for your patience as I venture into this side.
Market Updates, January 7 2026 I am pleased to present the Sotheby’s International Realty® brand’s 2026 ...
Times Are Tough, But Finding Low-Cost Fun Shouldn't Be Here Are Things To Do This Month FOR FREE Legacy’s ...
Jan. 02, 2026 | CREB 2025 housing market shifted to more balanced conditions Calgary, Alberta, Jan. 2, 2026– Following several years ...
READ POSTCREB® REALTORS® award $100,000 to seven non-profit organizations to ensure vulnerable Calgarians have safe, secure housing Calgary, ...
READ POSTConditions remain relatively balanced as we head into the winter months Calgary, Alberta, Dec. 1, 2025 – In line with typical seasonal ...
READ POSTNov. 03, 2025 | CREB Pace of new listings growth slows, preventing further inventory gains Calgary, Alberta, Nov. 3, 2025– Inventory ...
READ POST
Market Updates, January 7 2026
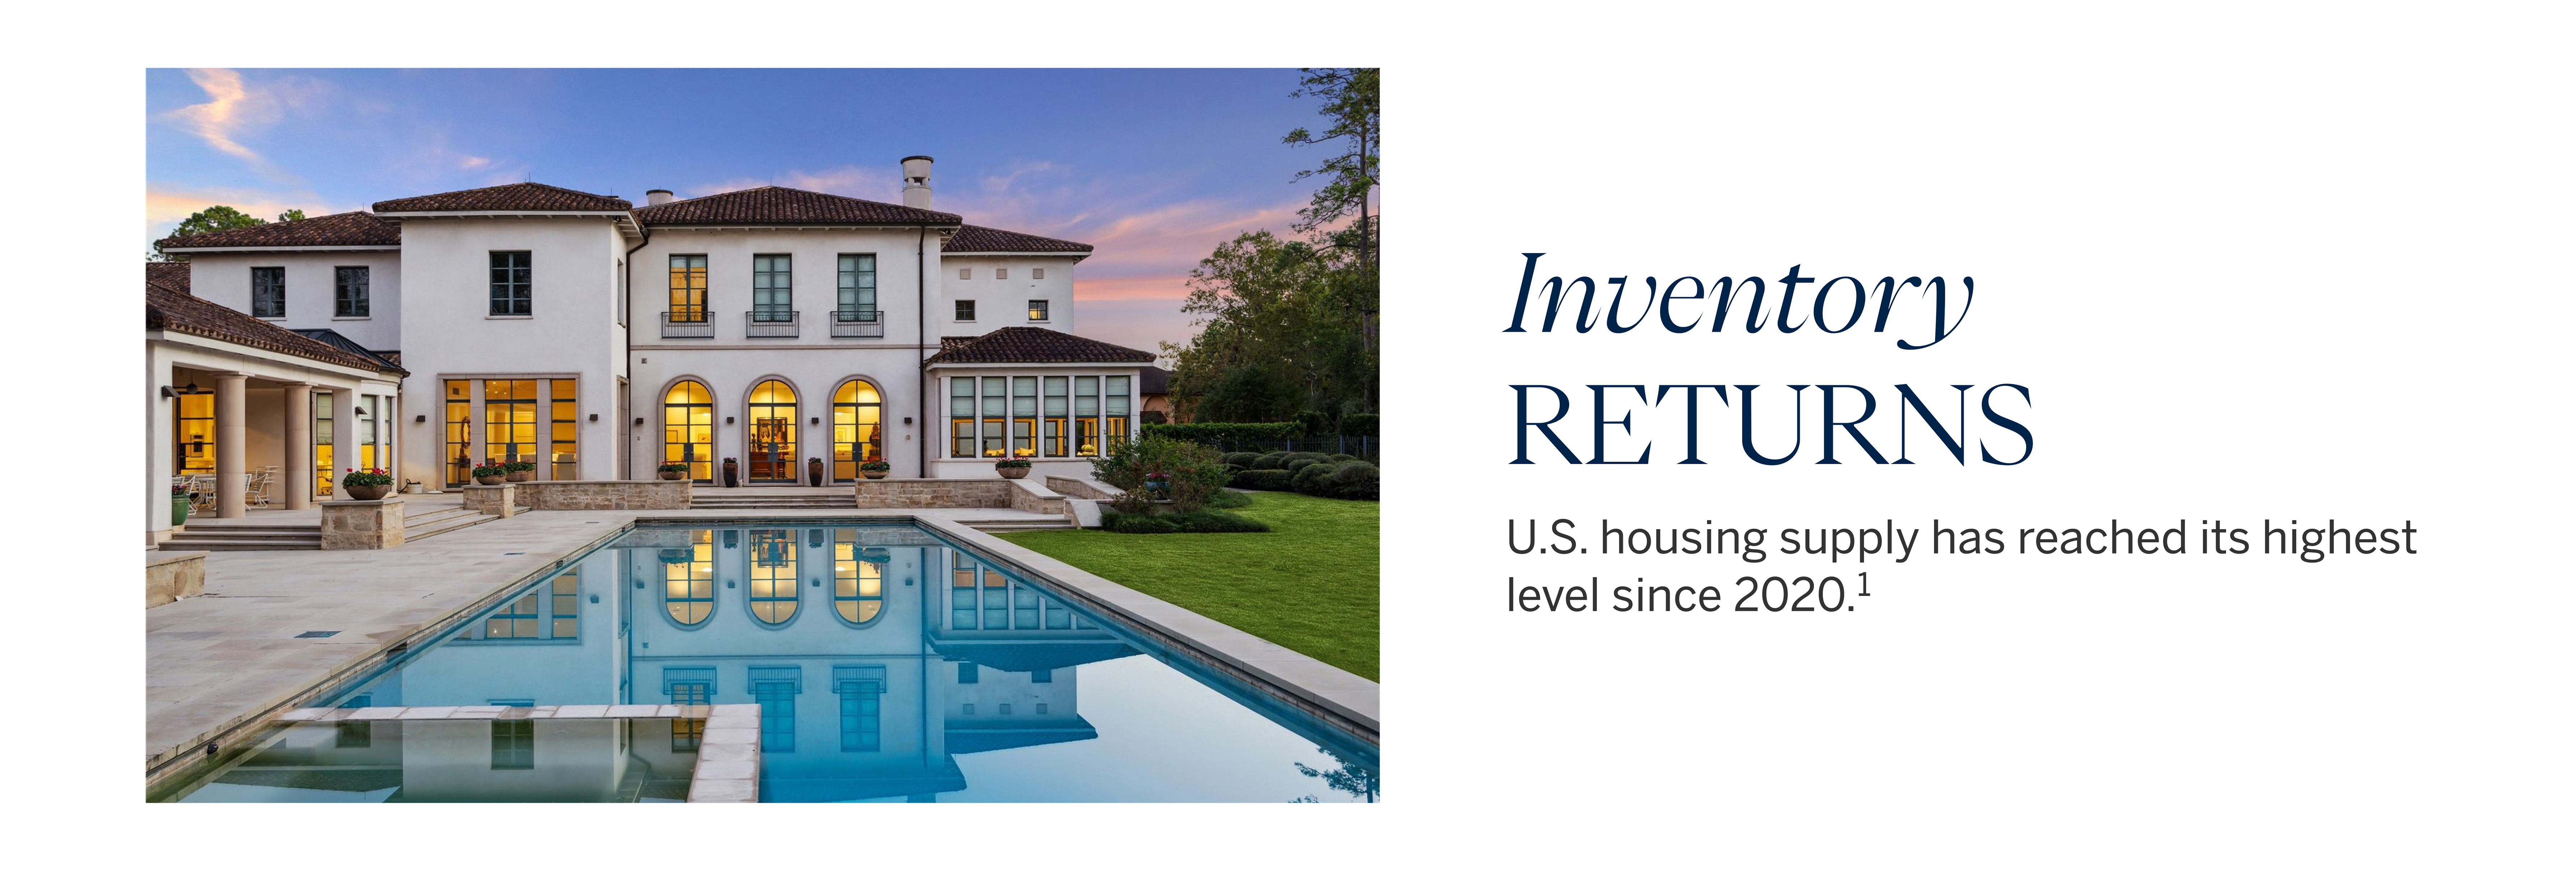
I am pleased to present the Sotheby’s International Realty® brand’s 2026 Luxury Outlook® report, an authoritative guide to the trends shaping the world’s most exclusive property markets.
Drawing on insights from leading financial voices and Sotheby’s International Realty affiliated agents worldwide, this year’s report delivers a comprehensive view of homebuyer motivations, real estate market sentiment, and emerging opportunities for homebuyers and home sellers.
The report explores key themes influencing high-net-worth homeowners, including the rise of multigenerational living, evolving housing supply, and the impact of major sporting events like the upcoming Winter Games on host markets. It also examines the shifting priorities around privacy and lifestyle and the growing influence of cryptocurrency in real estate transactions. These insights are designed to help you make confident decisions, whether you’re considering buying or selling a home.
Highlights from the 2026 Luxury Outlook report:


The Sotheby’s International Realty 2026 Luxury Outlook is a strategic resource for navigating today’s luxury real estate marketplace. I would be delighted to discuss how these insights can inform your real estate decisions for the year ahead or connect you with a Sotheby’s International Realty affiliated agent anywhere in the world.
Steven Hill
Senior Vice President, Sales and Associate Broker with Sotheby’s International Realty Canada located in beautiful Calgary, Alberta Canada
Jan. 02, 2026 | CREB
Calgary, Alberta, Jan. 2, 2026– Following several years of strong price growth, 2025 marked a year of transition thanks to strong demand and limited supply. Due to record high starts, supply levels improved across all aspects of the housing market, just as demand pressure eased due to a reduction in migration levels and heightened uncertainty that persisted throughout the spring market. This helped shift the resale market from one that favoured the seller to one that was more balanced.
In 2025, sales reached 22,751 units, down 16 per cent over last year, but in-line with long-term trends. Much of the shift came from the growth in supply. 2025 saw over 40,000 new listings come onto the market, nine per cent higher than last year, causing inventories to rise and driving more balanced conditions.
“Supply levels were expected to rise in 2025. However, the growth was higher than expected especially for apartment condominium and row homes. This weighed on prices in those sectors enough to offset the annual gains reported for both detached and semi-detached homes,” said Ann-Marie Lurie, CREB®’s Chief Economist. "Adjustments in both supply and demand varied across the city, with pockets of the market continuing to experience seller’s market conditions versus some areas where the conditions favoured the buyer. This resulted in different price trends based on location, price range and property type.”
Overall, the annual average total residential benchmark price in 2025 was $577,492, two per cent lower than last year’s annual average. However, annual detached and semi-detached prices rose by a respective one and three per cent, while apartment and row homes saw prices fall by a respective three and two per cent.
Compared to other districts, the North East reported the largest decline in prices this year. While some of this is related to improved supply across all areas of the city, it is also important to note that the North East district also reported the strongest price growth over the past two years.
For the first time in three years, we are heading into the New Year with better inventory levels. Details on what is expected to happen in the market in 2026 will be released at CREB®’s annual Forecast Conference on Jan. 20, 2026.
Detached
Detached sales totaled 11,328 in 2025, down by nearly nine per cent compared to last year. Sales eased across all districts in the city, with the steepest declines occurring in the North East, East and City Centre district. However, unlike the City Centre, the North East and East districts also experienced significant gains in inventory compared to long-term trends, driving annual price declines of two per cent. Meanwhile, in the City Centre detached inventory remained well below long-term averages, which likely prevented stronger sales and contributed to the annual price growth of over three per cent. Despite the differing conditions in different areas of the city, slowing sales and rising supply citywide helped move the market into balanced conditions by the second half of the year. The annual average benchmark price was $752,767, one per cent higher than last year’s annual level.
Semi-Detached
Semi-detached homes represent the smallest segment of the market, accounting for less than 10 per cent of all sales activity. Sales in 2025 were 2,159, eight per cent lower than last year, but slightly higher than long-term trends. Trends for semi-detached homes have been relatively consistent with the detached market. However, it took longer for this segment of the market to shift to more balanced conditions, resulting in stronger annual price gains. In 2025, the average annual benchmark price was $685,850, nearly three per cent higher than last year. Prices did ease in the North district as competition for new homes weighed on resale activity, but the decline in this district was more than offset by the four per cent gain in the City Centre.
Row
2025 sales eased by 17 per cent to 3,838 units. Despite the decline, sales were still higher than long-term trends, as row homes are starting to account for a larger share of the overall activity in the city. At the same time, new listings also rose relative to sales, driving inventory gains and taking the pressure off prices. Conditions shifted to more balanced levels relatively early in the year, and by the last quarter conditions ranged from a balanced to a buyer’s market depending on the districts of the city. Overall, this contributed to the annual average benchmark price decline of two per cent. While prices were relatively stable in the City Centre, North West, West and East districts, additional supply in the resale market and competition from new homes caused prices to decline by four per cent in the North East and North districts.
Apartment Condominium
Apartment-style homes reported the largest adjustment in price in 2025. Sales declined by 28 per cent compared to the near record high levels achieved last year. While the decline was significant, sales were still over 28 per cent higher than long-term trends. The main cause of the shift in conditions was due to the supply. Over the past three years, there has been a rise in apartment-style starts. While most of the apartment starts were purpose-built rental, they are adding to the supply choice and weighing on the resale market. Resale condominiums saw the market shift in favour of buyers by the second half of the year, with elevated months of supply being reported in most districts of the city. This resulted in relatively persistent downward pressure on prices, causing the annual average benchmark price to decline by nearly three per cent. Price declines were the steepest in the North East nearing five per cent. The only area to report relative stability in the annual price was in the West district.
Airdrie
Increased competition from the new home market, along with more supply options in competing resale markets, has contributed to the added supply in the resale market in Airdrie. Following four consecutive years of exceptionally low inventory levels, 2025 saw inventory rise to levels not seen since prior to the pandemic. While sales activity did remain in line with long-term trends despite an annual decline, the push up in inventories caused the months of supply to generally rise throughout the year. Overall, the annual average benchmark price eased by two per cent this year.
Cochrane
Sales in Cochrane were similar to last year and above long-term trends. While demand stayed relatively strong in the town, steady gains in supply did cause conditions to shift to a more balanced state by the end of 2025. With the shift occurring later in the year, we did not see the same downward pressure on prices. In fact, on an annual basis the benchmark price in Cochrane was $578,325, nearly three per cent higher than last year. Cochrane also tends to see a larger share of newer properties being listed and sold on the resale market, impacting the prices in the resale market.
Okotoks
Okotoks continued to struggle with supply growth. Inventories did rise by over 40 per cent, but levels were exceptionally low last year. Even with the gain in 2025, levels were still 30 per cent below long-term trends. Sales activity in the town remained consistent with the levels reported last year and were higher than long-term trends. The persistently low inventory levels generally kept market conditions relatively tight. However, total residential prices posted only a modest gain over last year, this is likely due to compositional shifts as price growth ranged from over one per cent for detached homes to nearly eight per cent for apartment condominium product.
Click here to view the full City of Calgary monthly stats package.
Click here to view the full Calgary region monthly stats package.
CREB® REALTORS® award $100,000 to seven non-profit organizations to ensure vulnerable Calgarians have safe, secure housing
Calgary, Dec. 8, 2025 – The CREB® REALTOR® Community Foundation is pleased to announce that it has awarded Transformation Grants totalling $101,020 to seven non-profit organizations that provide housing and shelter to vulnerable Calgarians.
This brings the amount awarded in 2025 through the foundation’s Community and Transformation Grants to $298,695 to 11 organizations, an increase of $139,000 over 2024.
In June, the foundation also awarded a three-year $1 million Legacy Grant to the Calgary Dream Centre for construction of its new Erlton House for women and families.
The organizations receiving the Transformation Grants are:
The Brenda Strafford Foundation
Calgary Drop-In & Rehab Centre Society
Central United Church – Central Outreach Hub Space
FearIsNotLove
Highbanks Independent Living for Parenting Youth Society
L'Arche Association of Calgary
Wood’s Homes
“These non-profit organizations are critical not only to the Calgarians who rely on them for a safe, secure place to call home. They’re critical to building the resilient communities that we all benefit from,” said Christian Twomey, Chair of the CREB® REALTOR® Community Foundation. “Each and every CREB® REALTOR® contributes to the foundation, because we understand that all Calgarians deserve a place to call home. These grants are one way that CREB® REALTOR®’s help the most vulnerable in the community find a safe and secure home.”
CREB® REALTOR® Community Foundation Transformation Grants help transform existing spaces and respond to community infrastructure needs, while the Community Grants are designed to fund major projects that keep vulnerable Calgarians housed. The Legacy Grant is intended to help Calgary non-profit organizations create significant new housing options for the clients they serve.
The Brenda Strafford Foundation
“We are grateful to the CREB® REALTOR® Community Foundation for this generous support, which will allow us to make necessary improvements to our programming space,” said Cara Bradley, Executive Director of The Brenda Strafford Foundation’s Heart Home Network. “This investment strengthens our ability to bring people together, share meals, and create a welcoming space for all. Thank you for helping us make a lasting impact for the people we serve.”
Calgary Drop-In & Rehab Centre Society
“CREB® REALTOR® Community Foundation’s generous funding will support a critical safety renovation at Bridgeland Manor, our affordable housing building for formerly homeless seniors. This handrail extension will eliminate a significant fall hazard at our front entrance, giving our residents the confidence to safely and independently access their home,” said Julia Gilbertson, grants officer at the Calgary Drop-In & Rehab Centre Society. “For seniors who have worked hard to transition from homelessness, this improvement makes a profound difference in their ability to maintain their autonomy and age in place securely. We're grateful to CREB® for this impactful gift that directly enhances the safety, independence, and quality of life for our residents.”
Central United Church – Central Outreach Hub
“This grant from the CREB® REALTOR® Community Foundation will help make our space safer, more dignified, and more functional for the over 1,000 people we serve each week,” said Brad Pert, the Program Coordinator of the Central Outreach Hub. “Improvements like better lighting, lockers, semi-private intake areas, and more accessible bathrooms and showers are based directly on what our guests have told us they need. We’re grateful for CREB®’s support in helping people move toward greater stability and housing.”
FearIsNotLove
“The Calgary Women’s Emergency Shelter is at the heart of the work we do at FearIsNotLove, offering safety and support to women and children fleeing serious threats of domestic violence and abuse. While their safety is our priority, we also strive to provide families with a comforting space to rest and heal,” said Lisa Zoppa, Manager of Resource Development at FearIsNotLove. “With the support of the CREB® REALTOR® Community Foundation’s Transformation Grant, we are creating a secure outdoor oasis at the shelter, a dedicated space for relaxation, healing, and play. We are grateful for this partnership and its impact on families seeking safety and hope at the Calgary Women’s Emergency Shelter.”
Highbanks Independent Living for Parenting Youth Society
“As a small organization with limited funding resources to update our apartments to ensure our young mothers are living in safe homes is paramount to ensuring that they can create a home for their tiny family,” said Shannon Johansen, Chief Executive Officer of Highbanks Society. “Our parenting youth work hard through education to change their lives and upgrading our aging appliances, some of them being original with 23 years of service, is a dramatic improvement to their living experience. We couldn't be more grateful for the support from CREB Realtor Community Fund and their belief in our program and services to our young mothers as we truly believe that they are ‘THE HOPE THAT LIVES HERE!’”
L'Arche Association of Calgary
"We are incredibly grateful to the CREB® REALTOR® Community Foundation for this generous transformation grant. This support comes at a pivotal moment for L’Arche Calgary as we prepare to rebuild our aging homes into fully accessible, inclusive spaces where persons with intellectual disabilities can continue to live with dignity, safety, and belonging,” said L’Arche Association Executive Director, Ani Hynes. “This gift strengthens the foundation we need to move confidently toward construction in mid-2026 and helps ensure our community can remain a place of stability, connection, and shared life for decades to come. We are deeply thankful for CREB®’s investment in our vision and for believing in what’s possible when people with and without disabilities build community together."
Wood’s Homes
“We are extremely grateful to the CREB® REALTOR® Community Foundation for their generosity and belief in our work,” said Wood’s Homes CEO, Bjorn Johansson. “Receiving this grant is deeply meaningful for Wood’s Homes as it strengthens our ability to deliver critical support to children, young people, and families who rely on us every day. This support not only fuels our mission of building good mental health so everyone can thrive in our community – it says ‘yes’ to young people who deserve safety, opportunity, and hope.”
About CREB® REALTOR® Community Foundation
CREB® REALTOR® Community Foundation is the community investment arm of CREB® (the Calgary Real Estate Board).
Made up of a membership of more than 8,700 REALTORS® and community members, CREB® REALTOR® Community Foundation exists to support the charitable and philanthropic activities of its members and to provide funding to housing- and shelter-related initiatives in Calgary and area.
Since its inception in 1987, the Foundation has contributed more than $8.4 million to a wide range of non-profit organizations in our community.
To learn more about the CREB® REALTOR® Community Foundation, visit creb.com.
Conditions remain relatively balanced as we head into the winter months
Calgary, Alberta, Dec. 1, 2025 – In line with typical seasonal trends, sales, new listings and inventory levels all slowed relative to last month. The 1,553 sales were met with 2,251 new listings, causing the sales-to-new-listings levels ratio to improve to 69 per cent. This also helped support some of the inventory adjustment. However, with 5,581 units in inventory, levels are still 28 per cent higher than last year and over 15 per cent higher than typical levels reported in November.
“Supply levels have been sitting higher than typical levels for the past three months, mostly due to the gains occurring in the higher-density sectors of row and apartment style units,” said Ann-Marie Lurie, CREB®’s Chief Economist. “This is partially related to the additional supply choice coming from the new homes sector, some of which end up on the resale market, especially near the end of the year. While buyer’s market conditions are more prevalent for apartment-style homes and to a lesser extent row homes, outside of a few pockets of the market, both the detached and semi-detached markets are relatively balanced.”
The additional supply choice across resale, new and rental markets, is having the most impact on apartment and row style home prices which are reporting year-over-year price declines of seven and six per cent. In comparison detached home prices are down by two per cent compared to last November, but still higher than last year when looking at year-to-date figures. Overall, the unadjusted total combined residential benchmark* price in November was $559,000, nearly five per cent lower than last year.
*To keep the benchmark price relevant, once a year the attributes of a benchmark home are reviewed and the benchmark prices are updated. The review has been completed and the data has been updated. While all historical adjustments have occurred, old PDF monthly reports are not adjusted.
Detached sales in November were 823 units, just slightly lower than last year’s level, and relatively consistent with activity reported for November. The monthly reduction in new listings helped push down inventory levels compared to last month, but inventory remained well above the lower levels reported last year and are now relatively consistent with long-term trends. Overall, the months of supply remained around three months, reflecting a relatively balanced condition. Despite this we did see unadjusted prices trend down over last month, mostly reflecting seasonal patterns. As of November, the unadjusted detached benchmark price was $733,000, down by nearly two per cent compared to last November. However, when considering the year-to-date figures, prices are still one per cent higher than last year. Most of the downward price adjustments have occurred in the North East, North and East districts as competition from new homes and additional supply choice in other parts of the city are more heavily weighing on those districts.
Sales in November were comparable to levels reported last year and still well above long-term trends, but with new listings also higher than typical levels for this time of year, inventories rose to the highest November level seen over the past five years. While conditions have been generally tighter for this property type, over the past three months we have seen the months of supply remain above three months, resulting in more balanced conditions. While the unadjusted benchmark price of $671,700 did ease over last month, it remained stable compared to last year. Year-to-date price growth has been the strongest in this sector at nearly three per cent, with the largest gains occurring in the City Centre at four per cent, partially offsetting the one per cent pullback in the North district.
November sales eased to 257, however, last year was a record high for the month and current sales remain above long-term trends. Where there continues to be more notable shifts is in supply. New listings remained comparable to last year and inventories, while reporting the typical seasonal decline, were at November levels not seen since 2018. The additional supply has caused the months of supply to remain slightly elevated, especially over the past three months. This has been placing some downward pressure on prices. In November, the unadjusted benchmark price was $424,400, down over last month and over six per cent lower than last year. While some of the monthly decline is seasonal, more persistent price declines have caused the year-to-date price to fall by nearly two per cent.
This sector has struggled the most with excess supply. November sales dropped to levels consistent with long-term trends, but new listings remained elevated and November inventory levels hit a record high for the month. The months of supply edged near six months and has been sitting above four months since the summer. This has resulted in relatively persistent price adjustments throughout the second half of the year and as of November the unadjusted benchmark price was $309,300, seven per cent lower than last year at this time. Year-to-date the decline was just over two per cent, with the largest decline occurring in the North East district at nearly five per cent. The only district to see prices remain flat was the West district.
As per typical seasonal behaviour, sales, new listings and inventory levels all eased over levels reported last month. Overall, both sales and new listings have remained at levels consistent with long-term trends for the month, but thanks to earlier gains inventory levels remain elevated for November. Some of the rise is due to a higher share of newer homes coming onto the resale market. The additional supply over the past several months has weighed on prices in Airdrie. While it has by no means offset the gains reported over the past four years, year-to-date benchmark prices for detached homes are down by nearly one per cent compared to last year.
The seasonal monthly pullback in new listings was not enough to prevent November levels from reaching a record high. While sales also remained relatively strong for November, it was not high enough to cause a more significant monthly pullback in inventories, which have not been this high in November since 2018. Some of the gains in new listings were due to a larger share of new homes being listed on the resale market. While recent gains in supply have caused some adjustments in price, prices continue to remain higher than levels reported last year. Year-to-date detached benchmark prices are nearly two per cent higher than levels reported last year.
Unlike other areas, sales in Okotoks improved compared to last month and were similar to levels reported last year. This in part could be related to the higher level of new listings that were available both in November and October, providing more choice to potential buyers. The Okotoks market has seen some recent gains in inventory levels, but overall supply remains well below long-term trends. Conditions have remained relatively tight in the Okotoks market and, despite some recent adjustments in prices, overall prices are still higher than last year on a year-to-date basis across each property type.
Click here to view the full City of Calgary monthly stats package.
Click here to view the full Calgary region monthly stats package.
Nov. 03, 2025 | CREB
Calgary, Alberta, Nov. 3, 2025– Inventory levels eased over last month thanks to the combined impact of a monthly pullback in new listings and a monthly pick up in sales.
With 6,471 units in inventory and 1,885 sales the October months of supply returned to three-and-a-half months after pushing up to four months in September. While both row- and apartment-style properties continue to report elevated supply levels compared to demand, conditions remain relatively balanced for both detached and semi-detached properties.
Year-to-date sales in the city totaled 20,082, down nearly 16 per cent compared to last year, but still in line with longer-term trends. Much of the decline in sales has been driven by pullbacks for apartment- and row-style homes.
“Improved rental supply and easing rents have slowed ownership demand for apartment- and row-style homes. It is also these segments of the market that have seen October inventories reach a record high for the month,” said Ann-Marie Lurie, CREB®’s Chief Economist. “Excess supply for apartment- and row-style properties is weighing on prices in those segments more so than any other property type, influencing total residential prices.”
As of October, the total unadjusted residential benchmark price in Calgary was $568,000, down nearly one per cent compared to last month and over four per cent lower than last year’s levels. The largest price adjustments occurred for row- and apartment-style properties where prices have eased by a respective six and seven per cent compared to last October.
Detached
October sales reached 1,012 units, an improvement over last month, but still five per cent lower than last year’s levels. At the same time there were 1,593 new listings that came onto the market, causing the sales-to-new-listings ratio to rise to 64 per cent and inventories to trend down over last month to 2,913. Inventory levels remain slightly higher than long-term trends for the month, but with just under three months of supply, conditions remain relatively balanced and far better than conditions reported during the 2015 to 2019 period. Despite relatively balanced conditions, there are pockets of the market that are experiencing buyer’s market conditions, which is impacting prices. Citywide detached benchmark prices eased to $744,400 in October, one per cent lower than last year. However, price adjustments ranged from a year-over-year gain of nearly two per cent in the City Centre to a decline of over five per cent in the North East district. Despite recent adjustments, year-to-date prices remain over one per cent higher than last year.
Semi-Detached
Sales improved over last month while new listings slowed, causing the sales-to-new-listing ratio to rise to 57 per cent, which is slightly lower than typical levels for this time of year, but high enough to prevent any significant change in inventory levels compared to last month. With 186 sales and 613 units in inventory, the months of supply was over three months, higher than last year’s extremely low levels, but lower than last month. More inventory choice has weighed on prices over the past several months. However, with an October benchmark price of $683,100, prices remain nearly one per cent higher than last year and on a year-to-date basis are over three per cent higher than last year.
Row
With 275 sales in October, year-to-date row sales totaled 3,412 units, a 17 per cent decline over last year. While row sales remain well above long-term trends, new listings have been on the rise and reached record highs so far this year. As of October, there were 1,054 units in inventory, the highest ever reported for the month and nearly 32 per cent higher than long-term averages. This also caused the months of supply to remain around four months. The additional supply choice has weighed on prices. The October benchmark price was $431,200, over one per cent lower than last month and nearly six per cent lower than prices reported last year at this time. The steady slide in row prices have caused year-to-date prices to drop by one-and-a-half per cent. Price adjustments did vary across the city with the largest year-to-date declines occurring in the North East and North districts.
Apartment Condominium
The pullback in new listings relative to sales this month did help prevent further gains in inventory levels. However, with 1,891 units in inventory and 412 sales, the months of supply remained elevated at nearly five months. Apartment condominiums have been experiencing buyer’s market conditions for nearly 6 months, placing downward pressure on prices. As of October, the benchmark price was $318,200, down over one per cent compared to last month, and nearly seven per cent lower than last October. On a year-to-date basis, prices are nearly two per cent lower than last year’s levels. The largest year-to-date price declines occurred in the North East and South East districts at four per cent, as those districts are either reporting the highest months of supply on the resale market or are facing significant competition from the new home market.
REGIONAL MARKET FACTS
Airdrie
Activity slowed as we moved into October. While sales have remained consistent with longer-term trends, new listings reached a record high for October, keeping inventories elevated. With 535 units in inventory and 136 sales, the months of supply remained over four months. The persistently higher months of supply over the past four months, combined with additional supply choice in the new home market, has weighed on resale home prices. Prices in Airdrie have been trending down since April of this year and as of October the benchmark price was $520,400, nearly one per cent lower than last month and nearly five per cent lower than last year’s levels.
Cochrane
Sales in Cochrane improved this month, keeping year-to-date sales at levels that are relatively consistent with last year. At the same time, while levels remained high, new listings did trend down over last month, causing the sales-to-new-listings ratio to rise to 55 per cent and preventing any further gains in inventory levels. The months of supply eased to just over four months in October, higher than the low levels reported over the past several years, but relatively more consistent with long-term trends for the month. As of October, the benchmark price was $585,200, similar to last month and over two per cent higher than last year. Year-to-date prices in the area have risen by nearly four per cent. Some of the gain in prices could be related to a larger share of new homes ending up being sold on the resale market in Cochrane.
Okotoks
October reported 91 new listings on the market, a significant gain over last month and last year’s levels. The rise in new listings was met with slower sales activity, causing the sales-to-new-listings ratio to dip below 50 per cent, supporting a modest gain in inventory levels. While inventory levels are finally improving, they remain low relative to longer-term trends. This has likely prevented a more significant shift in prices in the Okotoks area. In October, the unadjusted benchmark price was $618,600, up over last month but consistent with last October. Year-to-date benchmark prices have improved by over one per cent.
Click here to view the full City of Calgary monthly stats package.
Click here to view the full Calgary region monthly stats package.
Oct. 01, 2025 | CREB
Calgary, Alberta, Oct. 1, 2025– The 1,720 sales in September were not high enough to offset the 3,782 new listings coming onto the market, driving further inventory gains as we move into the fall. There were 6,916 units in inventory in September, 36 per cent higher than last year and over 17 per cent higher than levels traditionally reported in September. Both row and apartment style homes have reported the largest boost in supply compared to long-term trends.
"Supply levels have been rising in the resale, new home and rental markets. The additional supply choice is coming at a time when demand is slowing, mostly due to slower population growth and persistent uncertainty. Resale markets have more competition from new homes and additional supply in the rental market, reducing the sense of urgency amongst potential purchasers. Ultimately, the additional supply choice is weighing on home prices," said Ann-Marie Lurie, CREB® Chief Economist.
Supply levels relative to demand typically drive shifts in home prices. In September, the sales to new listings ratio dipped to 45 per cent, and the months of supply pushed up to four months for the first time since early 2020. This is a higher level of supply compared to demand than is typically seen in the Calgary market and, should this persist, we could see a market that shifts more in favour of the buyer. However, conditions do vary by property type, price range and location.
Inventory gains for apartment style homes over the past several months have contributed to buyer market conditions in this segment, driving year-over-year price adjustments of over six per cent for a total benchmark price of $322,900 in September. While the detached segment has also seen a rise in the months of supply, it has not been as high as the apartment condo sector. At a benchmark price of $749,900, detached home prices are only one per cent lower than last year, with most of the adjustments driven by the North East and North districts.
Detached
Sales in September slowed to 859 units, nine per cent lower than last year and below long-term trends for September. At the same time, new listings rose to 1,905 units, causing the sales to new listings ratio to fall to 45 per cent, levels not seen since 2018. While there has been an unexpected shift in September, it is too early to tell if this trend will continue as prior to this month the detached market has remained relatively balanced.
Improved supply choice is causing prices to decline relative to the record highs reported during the spring. As of September, the unadjusted benchmark price was $749,900, down nearly one per cent from both last month and last year. While prices have eased from peak levels across all districts, the largest decline occurred in the North East and East district at over six per cent. Despite recent adjustments on a year-to-date basis, prices remain nearly two per cent higher than last year's levels, with the City Centre reporting the highest gain at over four per cent.
Semi-Detached
New listings rose to 361 units in September, while sales fell to 156 units, causing the sales to new listings ratio to drop to 43 per cent. This also caused a rise in inventory levels and the months of supply pushed up to nearly four months. This is a significant shift compared to last month, where there was less than three months of supply.
Like the detached sector, it is too early to say if this trend will continue, but so far it has had minimal impact on home prices. As of September, semi-detached price was $684,800, slightly lower than last month and nearly one per cent higher than last year. Year-to-date price growth has been the highest for semi-detached homes at over three per cent, as this segment took longer to shift from a seller's market to one that was more balanced. Most of the price growth was driven by gains reported in the City Centre.
Row
Following a pullback last month, new listings posted modest monthly gains. The 592 new listings were met with 304 sales, causing the sales to new listings ratio to fall to 51 per cent. This is not as low as the other property types and at these levels it was enough to prevent any further monthly gain in the already elevated inventory levels. September inventory levels were 1,099 units, the highest September level reported since 2018, and 30 per cent higher than longer-term trends for the month. The largest gains in inventory occurred in the North East district, which also reported the highest months of supply and price decline compared to last year.
More supply choice has impacted resale prices, with the unadjusted benchmark price being $437,100. This is down less than one per cent over last month and nearly five per cent lower than last year's prices. Year-to-date price adjustments have been much smaller at one per cent, as declines in the North East, North and South East districts offset the gains reported in other parts of the city.
Apartment Condominium
The most significant adjustment in the market occurred in the apartment condominium sector as improving rental supply, delayed adjustments in interest rates and improved selection for other property types has slowed apartment style demand from both first-time buyers and investors. September reported 401 sales and 924 new listings, dropping the sales to new listings ratio to 43 per cent and causing inventory to rise to 1,999 units.
The rise in supply caused the months of supply to push up to five months, the first time it has done that since 2021. As elevated levels of supply have persisted since June, prices have been trending down. As of September, the benchmark price was $322,900, down over one per cent compared to last month and over six per cent compared to last year. The year-to-date price adjustment has been just over one per cent. Condo prices have slid across all districts compared to last September. The largest decline occurred in the North East district at over ten per cent, while the smallest decline occurred in the City Centre at five per cent.
Airdrie
New listings reached a September record high with 295 units. The gains in new listings were met with a pullback in sales causing the sales to new listings ratio to fall to 45 per cent and inventory rose to 571 units. While inventories have been generally trending up throughout this year, this is the first time that the months of supply pushed above four months since 2020. The improved options weighed on home prices, which continued to trend down this month. In September, the unadjusted benchmark price was $526,000, down one per cent compared to last month and nearly five per cent lower than last year's levels. Despite recent adjustments year-to-date prices declined by just over one per cent, not enough to offset last year's annual growth of eight per cent.
Cochrane
New listings in Cochrane also hit a September record high with 148 units. While sales are similar to last year's levels at 62 units, the boost in new listings did cause the sales to new listings ratio to drop to 42 per cent this month. This led to further inventory gains and the months of supply pushed above five months. Improved supply levels also took more pressure off home prices this month. In September, the unadjusted benchmark price was $584,300, down by nearly one per cent compared to last month, but still one per cent higher than last year's levels. Much of the supply adjustment has only recently occurred in the Cochrane market and the year-to-date benchmark price remains nearly four per cent higher than last year.
Okotoks
Okotoks was one of the few larger areas that did not see a lift in new listings in September. The 69 new listings were down compared to levels reported last year, and with 51 sales this month, the sales to new listings ratio remained elevated at 74 per cent. While inventory levels were only slightly higher than last month, the months of supply has remained relatively low at two and a half months. Despite the relatively tight conditions, prices continued to adjust in the market. This in part can be related to the competition from new properties, impacting resale prices. As of September, the total residential benchmark price was $613,900, down by over one per cent compared to last month and nearly three per cent lower than last September. Despite the adjustment, on a year-to-date basis, prices were still one and a half per cent higher than last year.
Click here to view the full City of Calgary monthly stats package.
Click here to view the full Calgary region monthly stats package.
Sept. 25, 2025 | CREB
City of Calgary, Sept. 16, 2025 – CREB® REALTOR® Community Foundation has awarded Community Grants to Society for Autism Support and Services, Inn from the Cold Society, Unison Society, and Discovery House Family Violence Prevention Society.
The foundation was able to increase the amount of annual funding this year with a total of $197,675 allocated to the Community Grant, which is $80,000 more than 2024. These grants will assist with major repairs and renovations to existing housing or shelter supply, with the goal of keeping people housed in their communities.
“These organizations are making a meaningful difference every single day, transforming lives and strengthening the communities they serve,” said Christian Twomey, Chair of the CREB® REALTOR® Community Foundation. “Every CREB® REALTOR® contributes to the foundation, and they take great pride in giving back to their city by helping charities who provide safe, stable housing to those who need it most.”
Society for Autism Support and Services (SASS)
Society for Autism Support and Services is a charity that offers specialized services to individuals with autism. The organization was founded in 1972 and has continued to grow ever since. They now offer early intervention, ECS programs, out of home living placements, life skills training and adolescent and adult vocational programs.
Grant funds will replace the bedroom windows in the facility used for the Out-of-Home Living Program. The new windows will improve the safety, privacy and energy efficiency of the aging building, thus making the bedrooms more comfortable for the children living there.
“Like many charities, Society for Autism Support and Services (SASS) faces the challenge of delivering high-quality programs while maintaining our aging facilities. This grant will help ensure that autistic youth with complex needs and their families, have access to safe housing that fosters learning and well-being. This grant will help us install new energy-efficient windows, reducing utility costs and allowing more resources to be directed toward vital programming. We look forward to partnering with the CREB® REALTOR® Community Foundation to complete the project,” said Kim Ward, Executive Director.
Inn from the Cold Society
Inn from the Cold is a charity that supports families in finding stability during times of crisis. Their three main programs supporting families experiencing the trauma and stress of homelessness, provide emergency and transitional shelter to families, and help families and expectant mothers facing homelessness find stable housing.
Inn from the Cold’s Journey House, a 10-unit affordable housing complex, needs essential repairs and upgrades to improve safety and quality of living for the residents. The grant funds will support improvements to the boiler room, HVAC, security systems and other facility upgrades.
“CREB® REALTORS® have stood beside us for many years, helping families experiencing homelessness find stability and hope. Thanks to their support, we’ve been able to improve the quality of our affordable housing and create safe, welcoming homes. We are so grateful for this partnership that continues to change lives,” said Heather Morley, CEO.
Unison Society
Unison Society is a non-profit organization that empowers individuals over the age of 50 to lead fulfilling lives. They do this through programs and services that promote a healthy lifestyle with good food, physical activity, courses and access to trusted resources.
“We are thrilled to be receiving funding from the CREB® REALTOR® Community Foundation. We will now be able to make vital infrastructure improvements to Unison’s Elder Abuse Shelter that provides a critical safe haven for seniors experiencing abuse, individuals often forced to flee their homes abruptly due to physical, emotional, or financial harm. Your support of our laundry room renovation is critical for daily living, hygiene and the dignity of seniors living in our shelter. We look forward to partnering with CREB® REALTOR® Community Foundation to improve the quality of the experience for the vulnerable seniors housed in Unison’s Elder Abuse Shelter,” said Larry Mathieson, President & CEO.
Discovery House Family Violence Prevention Society
For over 40 years, Discovery House Family Violence Prevention Society has served women and children leaving domestic violence, helping them rebuild their lives. Discovery House’s shelter was built in 2002 and the organization supports approximately 600 people a year, most of them children. The shelter has two-, three-, and four-bedroom apartments, a childcare centre, counselling rooms, community spaces, and an enclosed courtyard with a play area and garden.
The grant funds will go towards upgrading the building’s HVAC system to ensure it continues to operate efficiently. This will prevent disruptions to the families who utilize the shelter and allows Discovery House to provide a functional and safe environment.
"The support of the CREB® REALTOR® Community Foundation will help Discovery House provide families leaving domestic violence with the safety, stability, and supports they need to rebuild their lives. We are so grateful for this investment in creating brighter, safer futures for women and children in our community,” said Leslie Hill, Executive Director.
Sept. 02, 2025 | CREB
Calgary, Alberta, September 2, 2025 – Improving supply choice has changed the dynamics of the Calgary market driving price declines over the past several months.
Higher price adjustments are occurring for apartment and row style properties while detached and semi-detached properties have reported modest declines. As of August, the unadjusted total residential benchmark price was $577,200, down over last month and nearly four per cent lower than levels reported last year.
“Perspective is needed when it comes to price adjustments. The most significant price adjustments are occurring for row and apartment style homes as they are also the product type that are facing the largest gains in supply choice,” said Ann-Marie Lurie, Chief Economist at CREB®. “Meanwhile price adjustments in the detached and semi-detached markets range from modest price growth in some areas to larger price declines in areas with large supply growth. Overall, recent price adjustments have not offset all the gains that have occurred over the past several years.”
August reported 1,989 sales, nearly nine per cent lower than last year. Sales have slowed compared to the high levels reported over the past four years. However, activity is still above long-term trends, reflecting relatively strong demand. What has changed is the supply situation. New listings remain elevated, keeping the sales-to-new-listings ratio below 60 per cent and pushing inventory to 6,661, the highest August amount since 2019.
More inventory choice coupled with lower sales has caused the months of supply to rise to 3.4 months in August, much higher than the sellers' market conditions reported over the previous four years, but still well below the buyer market conditions observed prior to the pandemic. While the market is much more balanced compared to last year, there is significant variation depending on property type, price range and location.
Detached
Detached home sales eased to 995 units in August, while new listings rose to 1,748 units, keeping the sales-to-new listings ratio below 60 per cent. This prevented any significant shift in inventory, as the 3,051 units were the highest levels reported in August since 2020. Higher inventory levels and easing supply have helped balance out the detached market. However, districts like the North East, North and East are experiencing buyer market conditions.
The unadjusted benchmark price in August was $755,600 down by nearly one per cent over last month and last year's levels. While prices have eased there is significant variation depending on location. Compared to last year, prices reported the largest decline in the North East and East district at five per cent, while prices in the city centre were over two per cent higher. As many of the adjustments have occurred over the past few months, year-to-date Calgary prices remain two per cent higher than last year.
Semi-Detached
August sales improved over last year’s levels, but it was not enough to offset earlier pullbacks with year-to-date sales of 1,557—eight per cent lower than last year—but higher than long-term trends. At the same time, new listings slowed compared to sales pushing the sales-to-new listings ratio up to 67 per cent and preventing any further monthly inventory gains. Inventory gains have not been as high for this product type, and the months of supply remained below three months in August. This is one of the reasons that the prices have not seen the same adjustment.
In August the unadjusted benchmark price was $687,200 down over last month, but nearly one per cent higher than last year, and nearly four per cent higher on a year-to-date basis. Price growth has varied across the city, with the largest year-over-year gains occurring in city centre. Meanwhile the largest declines have occurred in the North East, East and North districts.
ow
Sales in August slowed, contributing to the year-to-date decline of nearly 16 per cent. While new listings did ease in August compared to last year and last month, they have generally been on the rise pushing up inventory levels. In August, there were 1,103 units in inventory, reaching the second highest level on record for August, only slightly lower than the record high in reported in 2018. Due to the relatively strong sales, the months of supply has only pushed slightly above three months, far more balanced than last year, but not as high as the 6.4 months report back in 2018.
Nonetheless, additional supply choice has weighed on prices. In August, the unadjusted benchmark price in the city was $439,600, reflecting the fourth consecutive monthly decline and nearly five per cent lower than last August. While prices eased across all districts, price declines exceeded five per cent in the North East, North, South and East districts. These districts generally reported high levels of supply in the resale sector or had significant competition from new home supply.
Apartment Condominium
Sales continue to slow in August contributing to a year-to-date pullback of nearly 30 per cent. While sales are still above long-term trends, they have not been high enough to offset the level of new listings in the market. In August alone there were 877 new listings compared to the 449 sales, keeping the sales-to-new-listings ratio relatively low at 51 per cent. The low ratio that has persisted throughout this year has contributed to the higher inventory levels seen in the market. While August inventory levels did not rise over last month, with 1,979 units available, this is the highest August inventory ever reported.
The months of supply for apartment condos have remained around four months since June. The excess supply relative to demand has been weighing on prices. As of August, the unadjusted benchmark price was $326,500, reflecting the fifth consecutive monthly decline and nearly six per cent lower than levels reported last August. Most of the supply is concentrated in the City Centre, which reported a year-over-year decline of five per cent, slightly higher than the rate of decline reported in the West district at three per cent. Meanwhile, the highest price declines occurred in the North East district at over 11 per cent.
REGIONAL MARKET FACTS
Airdrie
Easing sales in August contributed the year-to-date decline of 12 per cent for 1,248 sales so far this year. The 152 sales this month was met with 265 new listings, pushing the sales-to-new listings ratio up to 57 per cent and preventing any further monthly inventory gains. As of August, there was 535 units in inventory, above long-term trends and the highest levels reported since before the pandemic. The rise in supply has helped shift the market to more balanced conditions. However, with more supply options in both the new home, resale markets and in competing locations, there has been some downward pressure on prices in Airdrie. In August, the unadjusted total residential benchmark price was $531,100, down over last month and four per cent lower than levels reported last August.
Cochrane
The 70 sales this month were met with 139 new listings causing the sales-to-new listings ratio to fall to 50 per cent, the lowest ratio reported for August since 2015. The pullback in sales compared to new listings prevented any significant shift in inventory levels, pushed the months of supply up above four months. Despite the shift this month, prices in Cochrane remained relatively stable in August, with the unadjusted benchmark price sitting at $589,100, similar to last month and nearly two per cent higher than last year. On a year-to-date basis prices are four per cent higher than the previous year.
Okotoks
New listings in August reported a significant pullback relative to sales and the sales-to-new-listings ratio pushed up to 80 per cent. While sales have generally remained in line with long-term trends, new listings have not had the same increase that other areas have reported, preventing significant gains in inventory levels. As of August, there was 116 units in inventory, a 29 per cent gain over last year, but still 30 per cent lower than levels traditionally seen in August. Despite tighter conditions, prices have reported some monthly declines. However, year-to-date benchmark prices remained two per cent higher than last year’s levels, with gains reported across each property type.
Click here to view the full City of Calgary monthly stats package.
Click here to view the full Calgary region monthly stats package.
Aug. 01, 2025 | CREB
Calgary, Alberta, August 1, 2025–Thanks to gains mostly occurring in the newer communities, inventory levels in July were 6,917 units, reaching levels not seen since prior to the pandemic and higher than long-term trends. While supply has improved across all property types and all districts, the largest gains are occurring in the areas where there has been new community growth.
The additional supply has weighed on home prices in some parts of the city. The total residential benchmark price in Calgary has trended down over the past several months and is currently four per cent below last year's peak price reported in June 2024.
"Price declines are not occurring across all property types in all locations of the city, and even where there have been declines, it has not erased all the gains made over the past several years," said Ann-Marie Lurie, Chief Economist at CREB®. "The steepest price declines have occurred for apartment and row style homes, mostly in the North East and North districts, which coincides with significant gains in new supply."
The rise in supply occurred as sales continued to slow and new listings improved. In July, there were 2,099 sales, a 12 per cent decline over last year, while new listings reached 3,911 units, an over eight per cent increase over last year. In addition to the persistent economic uncertainty due to tariffs, sales and new listings were impacted by no further reductions in lending rates and added competition from the new home market. Apartment-style homes are reporting the highest months of supply with over four months, while both detached and semi-detached homes are seeing conditions remain relatively balanced at just three months of supply.
Detached
For the first time since 2020, the months of supply for detached homes rose to three months. Sales activity slowed to 1,031 units in July, while the number of new listings, despite being slower than last month, was still nearly 10 per cent higher than last year's levels and above long-term trends. The wider gap between sales and new listings led to a significant adjustment in inventory levels and, with slower sales, the months of supply rose to three months. However, conditions did vary significantly depending on location. In the North West, West and South districts, the months of supply remained well below three months, whereas the North East reported the highest months of supply at over four months.
A shift to balanced conditions has taken much of the pressure off home prices. As of July, the detached benchmark price was $761,800, down less than one per cent over last year. However, there was a significant range of price adjustments. Both the North East and East districts have reported the largest decline in price at five per cent, though prices still rose in the City Centre by nearly two per cent.
Sales activity in July continued to slow, contributing to the year-to-date decline of 11 per cent. At the same time, new listings have generally been higher this year compared to last year, supporting inventory gains. With 549 units in inventory and 187 sales, the months of supply in July rose to three months, something that has not happened since 2021.
Although supply is improving in relation to sales, prices have remained relatively stable. As of July, the benchmark price in the city was $697,500, one per cent higher than last July. Price growth did range throughout each district, with the highest gains occurring in the City Centre, with nearly three per cent growth. Meanwhile, prices declined over last year in the North East, East and North districts.
Like other styles of homes, sales have eased compared to last year, with new listings and inventories rising over last July. The months of supply in July was similar to last month at over three months, with a range of under three months of supply in the City Centre, North West , South and South East, to nearly five months of supply in the North East district.
Row prices have generally been trending down over the past three months, and while they are nearly four per cent lower than last year at this time, on a year-to-date basis they have remained similar to last year. When considering activity by district, year-to-date price declines have been reported in the North East and North, while prices have risen in all other districts.
There were 1,014 new listings in July relative to 508 sales, keeping the sales-to-new listings ratio at 50 per cent and inventory levels elevated at 2,097 units. Higher inventories and slower sales caused the months of supply to push above four months in July, the highest it has been since 2021. Added competition for new product combined with rising rental vacancy rates has impacted the resale condominium market.
The additional supply choice is having a more significant impact on apartment style prices over any other property type. In July, the benchmark price was $329,600, which is down over one per cent compared to last month and nearly five per cent lower than levels reported last year. However, when considering year-to-date figures, prices have remained stable compared to last year as gains in the West, South and North West have offset declines occurring in the North East, North, South East and East districts.
Due to declines in both row and apartment sales, July sales slowed by 14 per cent compared to last July, contributing to the year-to-date decline of 12 per cent. While sales have slowed, activity remains higher than levels reported prior to 2021. What has changed is the significant improvement in new listings, resulting in inventory gains. As of July, inventory levels rose to 543 units, the highest July reported since the peak in 2018. The higher inventory levels kept the months of supply above three months in July, placing some downward pressure on home prices. In July, the benchmark price was $532,800, nearly four per cent lower than levels reported last year at this time. However, last year's gains were exceptionally high earlier in the year, and on a year-to-date basis prices are only slightly lower than last year.
Unlike other areas, Cochrane has not seen the same level of pullback in sales compared to long-term trends. While July sales were down by seven per cent, year-to-date sales are two per cent lower than last year and 23 per cent higher than long-term trends. New listings in July did reach a record high for the month, causing inventories to push to the highest level reported for the month since 2019 and causing the months of supply to rise above three months. While this likely contributed to some of the monthly decline in price, unlike other areas the July benchmark price of $590,000 was over two per cent higher than last year, and four per cent higher on a year-to-date basis.
Okotoks
This market continues to exhibit tighter market conditions than both Airdrie and Cochrane with a sales-to-new-listings ratio of 71 per cent and months of supply at just over two months. This is a significant improvement compared to the previous four years, where the months of supply in July was just over one month. In July, the benchmark price in the area was $628,500, slightly lower than last month, but higher than last year's level. Despite some monthly fluctuations, year-to-date prices are over two per cent higher than last year.
Click here to view the full City of Calgary monthly stats package.
Click here to view the full Calgary region monthly stats package.
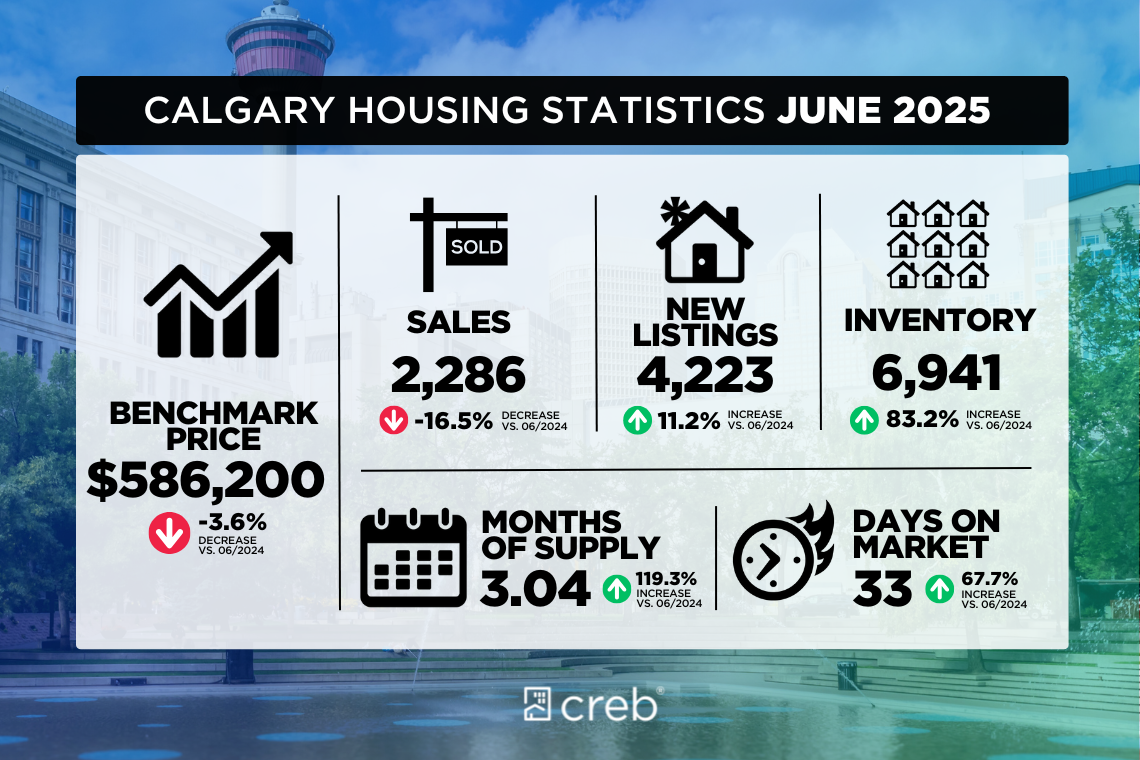
July 02, 2025 | CREB
Calgary, Alberta, July 2, 2025 –Inventory levels in June continued to rise, both over last month’s and last year’s levels. By the end of the month, inventory reached 6,941 units, returning to levels reported in 2021, or prior to the surge in population growth.
While sales have remained consistent with long-term trends despite a decline from recent months, higher levels of new listings compared to sales have contributed to the inventory gain. All property types have reported gains in inventory, but both row and apartment style homes reported inventory levels over 30 per cent higher than long-term trends, while supply for detached and semi-detached units are only slightly higher than typical levels.
“Supply has improved across rental, resale and new home markets, allowing for more choice for those considering their housing options,” said Ann-Marie Lurie, Chief Economist at CREB®. “The additional choice combined with no further declines in lending rates, persistent uncertainty and concerns of price adjustments is keeping many potential purchasers on the sidelines. This is weighing on home prices, especially for apartment and row style homes.”
The unadjusted benchmark price was $586,200 in June, lower than last month and over three per cent lower than last year. Much of the citywide decline was driven by apartment and row style homes, which are over three per cent lower than last year. Meanwhile, detached prices have remained relatively stable and semi-detached homes are still slightly higher than last year.
The steeper price declines for apartment and row style homes are reflective of those segments shifting toward a market that favours the buyer with nearly four months of supply. Meanwhile conditions are relatively balanced for detached and semi-detached homes. Overall conditions in Calgary have changed, but not enough to erase the significant growth in prices that have occurred over the past four years.
Sales in June were 1,194 units, six per cent lower than both last year and last month's activity. Sales activity did vary depending on location and price range, with declines in resale sales mostly for higher priced homes that likely face more competition from new homes. On a location basis, the steepest declines in sales occurred in the City Centre and the North East at over 20 per cent, while year-over-year gains were reported in the West, and South East districts.
While sales did vary, inventories and new listings improved across most price ranges and districts in the city. However, it is only the North East district that is experiencing conditions that favour the buyer, causing prices to decline by four per cent compared to last June. As of June, the unadjusted benchmark price in Calgary was $764,300, less than one per cent lower than both last month and last year’s price.
Sales activity continued to slow this month, contributing to the year-to-date decline of nearly 12 per cent. At the same time new listings have generally been rising compared to last year, supporting inventory gains and a shift to balanced conditions. As of June, the months of supply was 2.6 months, a significant improvement over the tight conditions reported last year.
Additional supply choice has slowed the pace of price growth for semi-detached homes. As of June, the benchmark price in the city was $696,400, similar to last month, and over one per cent higher than last June. Price movements did range by district, as homes in the City Centre are over three per cent higher than last year and at record high levels, while prices in the North, North East, and East districts are all over two per cent lower than last year and three per cent lower than last year’s peak price.
New listings continue to rise relative to the number of sales in the market, as the sales-to-new listings ratio in June dropped to 50 percent. This contributed to further inventory gains with 1,167 units available at the end of the month. While sales are still higher than long-term trends, the recent gains in inventory levels have caused the months of supply to push above three months. Within the city, conditions range with nearly six months of supply in the North East and two and a half months of supply in the North West.
Higher supply levels relative to demand are weighing on prices which, at a June benchmark price of $450,300, are down over last month and three per cent lower than last year’s levels. However, as the level of oversupply does range across the districts, so too do the price movements. The City Centre has seen the most stability in prices this month and is only one per cent below last year’s peak. Meanwhile, the North East is reporting year-over-year price declines of nearly six per cent.
June new listings and sales both eased over last month’s and last year’s levels. However, with 1,024 new listings and 532 sales, inventories continued to rise and the months of supply pushed up to nearly four months. Slower international migration numbers are weighing on housing demand just as supply levels are rising, which is having a larger impact on apartment style homes.
The rising supply choice, both in new and resale markets, has caused resale prices to trend down again this month, leaving June’s benchmark price of $333,500 over three per cent lower than last year’s levels. While prices have eased across all districts in the city, the largest year-over-year declines are occurring in the North East, North and South East districts.
Thanks to a sharp decline in detached activity, sales in June fell to 164 units. The pullback in sales was met with 324 new listings, causing the sales-to-new listings ratio to drop to 51 per cent, the lowest ratio reported in June since 2018. The wider spread between sales and new listings drove further inventory gains and for the first time since 2020 the months of supply was above three months. The additional supply choice has weighed on resale prices, which have trended down for the second consecutive month. In June the benchmark price was $538,300, nearly three per cent lower than levels seen last year at this time.
Cochrane
Gains for detached and semi-detached sales were offset by pullbacks for row and apartment units, as June sales remained relatively unchanged over last year. The 101 sales in June were met with 171 new listings and the sales-to-new listings ratio rose to 59 per cent. This slowed the pace of inventory growth, keeping the months of supply just below three months. While conditions are more balanced than they have been, prices in the area continue to rise albeit at a slower pace. As of June, the unadjusted benchmark price was $593,700, nearly one per cent higher than last month and four per cent higher than last June.
While levels are better than last year, both sales and new listings trended down in June, causing the sales-to-new listings ratio to rise to 87 per cent. This prevented any further monthly inventory gains and ensured that the months of supply remained below two months in June. While conditions remain tight in Okotoks, more supply in the broader region has likely prevented stronger price growth in the Town of Okotoks. As of June, the unadjusted benchmark price was $632,800, similar to last month and nearly three per cent higher than last year.
Click here to view the full City of Calgary monthly stats package.
Click here to view the full Calgary region monthly stats package.
Market Updates, January 7 2026 I am pleased to present the Sotheby’s International Realty® brand’s 2026 ...
Jan. 02, 2026 | CREB 2025 housing market shifted to more balanced conditions Calgary, Alberta, Jan. 2, ...